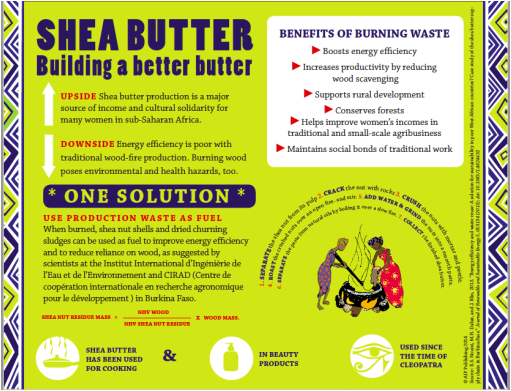
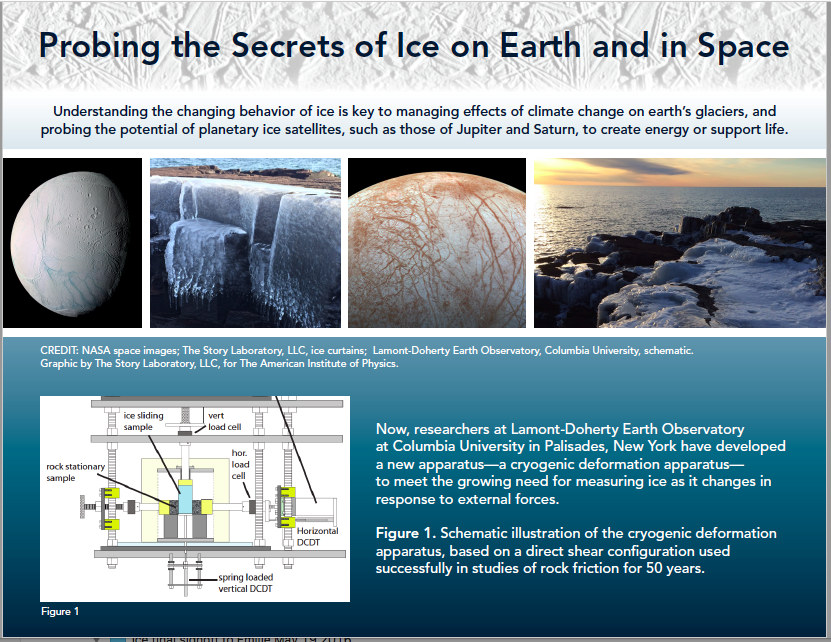
The Story Laboratory, LLC
  • Home
  • Science Writing
  • Infographics
  • Teaching & Speaking
  • Portfolio & Awards
  • Pop-up College
  • Clients
  • Regenerate

Informational  Graphics

Picture
©thestorylaboratory_1.30.22_email_seduced_by_money.pdf
File Size: 2938 kb
File Type: pdf
Download File

Data Graphics

Informational graphics compress and clarify multistep processes and complex conceptual relationships. They do this through the strategic integration of words, images and data graphics, informed by theories of visual rhetoric.

We think of our informational graphics as visually powerful explanatory habitats where meaning grows and understanding thrives: sites of insight.

Close communication with clients in a quietly iterative process helps us determine not only the cognitive freight an informational graphic must bear, but its emotional charge as well. We then integrate the rhetorical possibilities of visual elements, story line and historical context to communicate core messages.
Picture
Picture
Picture
Picture

At The Story Laboratory...

The discipline of visual rhetoric informs our graphics to:
  • Strategically deploy images to make persuasive arguments.
  • Ensure we are not merely decorating pages--and instead, are elaborating ideas by engaging specific neurocognitive perceptual mechanisms.
  • Create maximum communication value by distributing cognitive cargo over words and images.
​
Picture
Picture
Picture
Picture
Picture
Picture
The Story Laboratory, LLC. ©2001-2022. All Rights Reserved.
Powered by Create your own unique website with customizable templates.
  • Home
  • Science Writing
  • Infographics
  • Teaching & Speaking
  • Portfolio & Awards
  • Pop-up College
  • Clients
  • Regenerate